
What is CAGR? Meaning, Examples, and Its Role in Investments
What is CAGR?
The Compound Annual Growth Rate (CAGR) is one of the most reliable metrics for evaluating how an investment or business grows over time. At its core, CAGR meaning refers to the average annual rate of return that smooths out fluctuations by assuming the investment grew at a steady pace each year.
Unlike simple growth calculations, which only look at beginning and ending values, CAGR accounts for the effect of compounding. This makes it especially useful for comparing investments, analyzing company performance, or assessing portfolio returns across multiple years.
In financial analysis, understanding what is CAGR helps investors and business leaders answer key questions: How fast has an investment truly grown? How does one opportunity compare with another? And is the growth sustainable over the long term?
By converting complex and uneven growth patterns into a single, easy-to-interpret number, CAGR provides a clear picture of performance—making it an essential tool for smarter financial decisions.
How CAGR is Calculated
The CAGR formula provides a straightforward way to measure consistent annual growth over a defined period. Unlike an average return, which simply adds up yearly percentages, CAGR smooths the results to show how much an investment would have grown if it had increased at the same rate every year.
The Formula
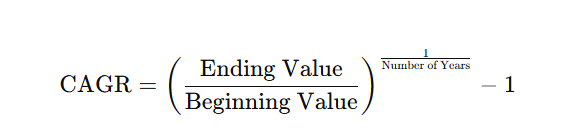
Example Calculation
Suppose you invested $1,000, and after 3 years, it grew to $1,500.
[caption id="attachment_156193" align="alignnone" width="588"] How CAGR is Calculated[/caption]
This means the investment grew at an average annual rate of about 14.5%, even if the actual growth varied from year to year.
By understanding what is CAGR and applying the formula correctly, investors and analysts can gain a clearer picture of long-term performance compared to relying on simple averages.
What is CAGR in Mutual Funds?
For mutual fund investors, understanding what is CAGR in mutual fund analysis is essential to evaluating long-term performance. Mutual funds often fluctuate year to year due to market conditions, but CAGR helps smooth these variations into a single annualized growth rate, making comparisons easier.
How Investors Use CAGR
- Performance Tracking: Investors use CAGR to measure how much their mutual fund has grown over a specific period, whether it’s 3 years, 5 years, or longer.
- Comparisons: CAGR allows investors to compare one mutual fund’s growth against others or against benchmark indices.
- Goal Setting: By analyzing CAGR in investments, investors can decide if a fund is meeting their financial goals or if they need to adjust their portfolio.
Example: Lump-Sum Investment
Suppose you invested ₹1,00,000 in a mutual fund, and after 5 years, its value grew to ₹1,80,000.
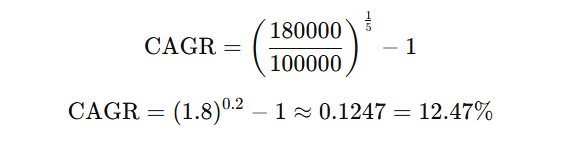
This means your mutual fund generated a steady annualized return of about 12.5% per year.
Why CAGR is Better Than Average Annual Return
Unlike average annual returns, which can be distorted by one strong or weak year, CAGR shows the true compounded growth of the investment. That’s why it is considered more reliable when evaluating mutual funds over time.
In short, CAGR in investments gives mutual fund investors a realistic measure of performance, helping them make smarter and more consistent decisions.
What is CAGR in Stock Market?
In the world of equities, understanding what is CAGR in stock market analysis is essential for measuring the true performance of a stock. Share prices can fluctuate daily due to market trends, news, or investor sentiment, making it difficult to gauge consistent long-term growth. CAGR solves this problem by providing a single, annualized percentage that reflects steady growth over time.
Role of CAGR in Stocks
- Price Appreciation: Investors use CAGR to measure how much a stock’s price has appreciated over a defined period.
- Comparisons: CAGR allows direct comparisons between different stocks, sectors, or indices, regardless of volatility in individual years.
- Investment Decisions: By analyzing CAGR in stocks, investors can determine whether a company has delivered sustainable long-term growth compared to its peers.
Example: Stock Growth Over 5 Years
Suppose a stock is purchased at $50 and, after 5 years, its price increases to $200.
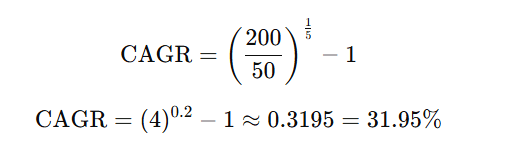
This means the stock achieved an average annualized growth rate of about 32% over the 5-year period.
Why CAGR is Useful in Stock Market Analysis
- Smooths out market volatility and short-term price swings.
- Provides a more realistic picture of how a stock performs over time.
- Helps investors compare long-term stock growth against benchmarks or alternative investments.
In summary, knowing what is CAGR in stock market terms helps investors focus on long-term performance and make more informed decisions when selecting stocks.
What is XIRR and CAGR: Key Differences
While CAGR is one of the most common ways to measure investment growth, it isn’t always the most accurate in cases where cash flows occur at different times. That’s why many investors also rely on XIRR. Understanding what is XIRR and CAGR together helps in choosing the right method for different investment scenarios.
CAGR: The Constant Growth Rate
- Definition: CAGR assumes a steady annual growth rate between a beginning and ending value.
- Best For: Lump-sum investments, stock price appreciation, or business revenues measured over fixed periods.
- Limitation: Does not account for irregular contributions or withdrawals.
XIRR: Flexible for Cash Flows
- Definition: XIRR (Extended Internal Rate of Return) calculates the annualized return while considering the exact dates of cash inflows and outflows.
- Best For: SIPs (Systematic Investment Plans), recurring investments, or scenarios with multiple deposits and redemptions.
- Advantage: Provides a more realistic return figure when investments are made at different times.
Example: CAGR vs XIRR in Mutual Fund SIP
Suppose an investor puts ₹10,000 every year for 3 years into a mutual fund. After 3 years, the investment grows to ₹40,000.
- CAGR Calculation (lump sum assumption):
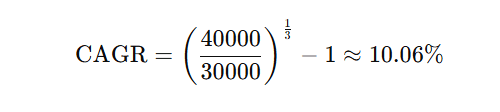
This assumes the money was invested all at once, which isn’t accurate. - XIRR Calculation (with actual dates):
XIRR considers that ₹10,000 was invested in Year 1, another ₹10,000 in Year 2, and the final ₹10,000 in Year 3, then redeemed at ₹40,000. This would yield a higher and more realistic return (closer to ~18–20%, depending on dates).
Key Takeaway
- CAGR vs XIRR: Use CAGR for lump-sum investments and XIRR for SIPs or any case with irregular cash flows.
- Together, they give investors a clearer picture of true returns and help avoid misinterpretation of performance.
What is a Good CAGR?
When evaluating investments, one of the most common questions is: what is a good CAGR? The answer depends largely on the asset class, risk level, and time horizon. A good CAGR percentage is not universal—it varies based on where the money is invested and what benchmarks are considered reasonable.
Mutual Funds
For long-term mutual fund investments, a CAGR of 10–12% is often considered strong. Equity mutual funds, in particular, aim to deliver double-digit CAGR over a 5–10 year horizon, although actual returns depend on market conditions.
Stock Market
In the stock market, a CAGR of 12–15% is seen as an excellent growth rate for established companies. High-growth stocks may show higher CAGRs, but they usually come with more volatility and risk. Comparing a stock’s CAGR against benchmark indices like the S&P 500 provides context on whether it is outperforming the market.
Real Estate and Business Growth
- Real Estate: Historically, property investments often deliver a CAGR of 6–9%, depending on location and market cycles.
- Business Growth: For businesses, a good CAGR percentage depends on the industry. Tech companies may aim for 20%+ CAGR, while more mature industries may consider 5–10% sustainable growth.
Key Takeaway
A “good” CAGR must always be evaluated relative to the asset, risk, and economic environment. What looks strong in one sector may be average in another. Investors should balance CAGR expectations with risk tolerance and long-term goals.
Advantages and Limitations of CAGR
Like any financial metric, the Compound Annual Growth Rate has both strengths and weaknesses. Understanding CAGR advantages and CAGR limitations helps investors and analysts apply it correctly and avoid misinterpretation.
Advantages of CAGR
- Easy to Calculate: With a simple formula, CAGR provides a quick way to measure growth over time.
- Smooths Volatility: By assuming steady annual growth, it eliminates the noise of year-to-year fluctuations.
- Great for Long-Term Comparisons: Investors can compare performance across stocks, funds, or businesses on an equal footing.
- Widely Understood: CAGR is a standard metric in finance, making it useful for communicating results to stakeholders.
Limitations of CAGR
- Ignores Interim Volatility: CAGR doesn’t show the ups and downs within the investment period—it only reflects the start and end values.
- Not Suitable for Irregular Investments: CAGR works best for lump sums but can be misleading for SIPs or multiple cash flows. In such cases, XIRR or IRR provide more accurate results.
- Assumes Constant Growth: CAGR suggests smooth growth, which may not reflect reality in volatile markets.
Key Insight
While CAGR is a powerful tool for evaluating long-term performance, it should be used alongside other metrics—such as annual returns, volatility measures, or XIRR—for a complete financial picture.
FAQs About CAGR
What does CAGR tell you about an investment?
CAGR shows the average annualized growth rate of an investment over a specific period. Instead of focusing on short-term fluctuations, it provides a smoothed percentage that reflects how much the investment would have grown if it had increased at a steady rate each year. This makes what is CAGR a key question for anyone evaluating long-term performance.
Why is CAGR important for mutual funds?
Mutual funds often have irregular returns due to market volatility. CAGR helps investors look beyond those ups and downs and see the true annualized return over multiple years. It also allows easy comparison between funds or against benchmark indices, making it one of the most practical metrics in CAGR FAQs for mutual fund analysis.
Is CAGR always reliable?
CAGR is reliable for measuring long-term growth but has limitations. It does not reflect interim volatility or risks taken to achieve the return. For investments with multiple cash inflows and outflows (like SIPs), IRR or XIRR may provide more accurate results.
Can CAGR be negative?
Yes. A negative CAGR means the investment declined in value over the given period. For example, if a stock drops from $100 to $60 in 3 years, the CAGR will be negative, indicating an average annual loss rather than growth.
Conclusion
The Compound Annual Growth Rate (CAGR) is a powerful tool for simplifying complex performance data into a single, steady growth rate. Whether applied to CAGR in mutual funds or CAGR in stock market analysis, it helps investors cut through volatility and gain a clearer understanding of long-term returns.
While CAGR is highly effective for lump-sum investments and long-term comparisons, it should not be used in isolation. To get a more complete picture—especially when dealing with irregular investments like SIPs—metrics such as XIRR or IRR provide greater accuracy.
For investors, the takeaway is simple: use CAGR as your go-to metric for evaluating steady growth, but always complement it with other tools for better decision-making. Start by calculating CAGR for your own investments in mutual funds, stocks, or businesses, and compare it against benchmarks to see if you’re truly on track with your financial goals.
By applying CAGR consistently and wisely, you’ll be better equipped to make informed, data-driven investment decisions.